how to draw a phylogenetic tree and the evolutionary changes
What is Phylogenetic Analysis?
The study of the evolutionary development of a species or a group of an organism or a particular characteristic of an organism or to analyze the relationship within and among the species is known as phylogenetic analysis.
- Branching diagrams are made to represent the evolutionary history relationship between the same or different species and organisms during the phylogenetic analysis that has been developed from a common ancestor.
- It is also used to analyze the characteristics of an organism's genes, proteins, organs, etc.
- The diagram that is used during the phylogenetic analysis is also known as the phylogenetic tree.
- Phylogenetic analysis is used for different purposes that include a collection of biological diversity information, information on genetic classification, as well as learning of different developmental stages that occur during evolution.
- As the sequencing techniques have been advancing at a rapid pace, phylogenetic analysis has been used to understand the evolutionary relationship among the species by comparing the sequences of the gene.
- When the genetic materials are not available then the morphological estimates can be used to differentiate the evolutionary relationships.
- But most of the recent phylogenetic analysis software and algorithms have limitations to low accuracy, high time complexity, complex results, and restriction assumption on the size of the database.
- When two sequences of two organisms are quite similar, then we assume that both of the organisms have been derived from the same ancestors.
To understand the distance, clade, taxa, and the relationship between the species in a tree, it is important to understand the phylogenetic tree.
What is Phylogenetic Tree?
- The diagram that represents the lines of evolutionary descent of different species, organisms, or genes from a common ancestor is known as a phylogenetic tree or simply phylogeny.
- Since the time of Charles Darwin, tree diagrams have been used in evolutionary biology.
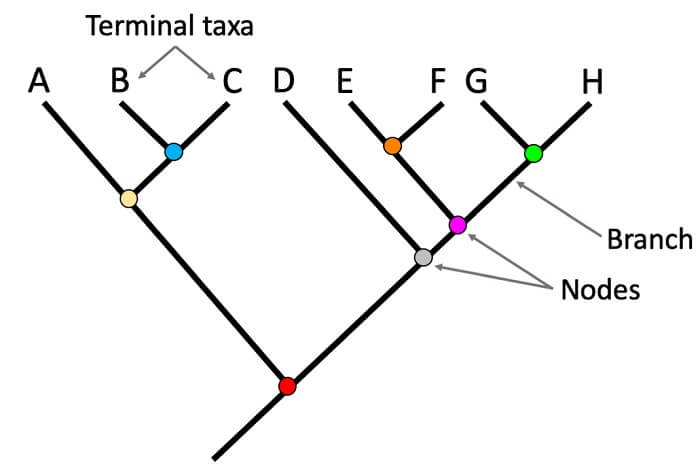
- The tree is compared on the basis of leaves (tips), nodes, and branches where the two nearby nodes (taxonomic units) are connected by one branch (internal branch).
- In the phylogenetic tree, species, population, individuals, or trees are represented by leaves, and these leaves can be connected to nodes with the help of a branch (external branch).
- The flow of genetic information between subsequent generations is determined by the branch, and genetic change or divergence is denoted by the branch length.
- Similarly, the average number of nucleotide substitutions per site generally estimates the degree of divergence.
- A node represents the exact position of two or more descendant lineages generation from an ancestral lineage while analyzing the phylogenetic tree from the roots towards the tips.
- But the evolution occurs autonomously in the case of newly generated lineages.
- Topology represents the evolutionary development of the generation through the progressive branching pattern created by lineage splitting.
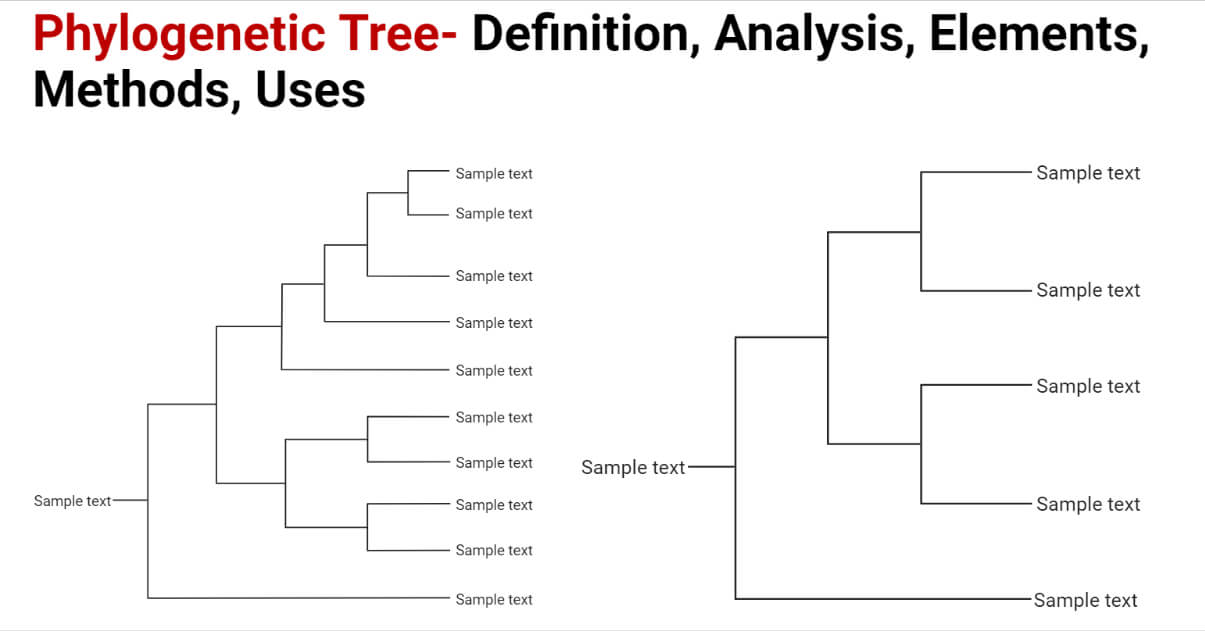
- The phylogenetic tree can be rooted or unrooted as well as scaled or unscaled, depending on our study requirements and what kind of tree we require.
- So rooting of the phylogenetic tree is essentially required for a better understanding of the directionality of evolution and genetic evidence.
- There are various methods to accurately estimate the tree root using gene sequence data and assumptions that include a molecular clock, midpoint rooting, and outgroup rooting.
- Whereas the phylogenetic tree that is unrooted only represents the relationship among the species without showing the ancestral root of origin.
- Similarly, in a tree that is scaled relationship that exists between the branch length and the amount of genetic divergence that took place on the branch is proportional.
Distance Estimation
- For a pair of sequences, the evolutionary distance is usually measured by the number of nucleotide or amino acid substitutions between them.
- Similarly, for the study of molecular evolution, evolutionary distance is a must.
- Evolutionary distance is also useful for phylogenetic reconstruction and estimation of divergence times.
- There is software for the estimation of the distance of nucleotides and amino acid sequences, and that software is known as MEGA.
Distance estimation is generally presented in the following three sections:
1. Nucleotide substitutions
The number of nucleotides substitutions per site (d) between the sequences is generally estimated by computing the evolutionary distance from DNA sequence data. Hence, depending on the pattern of the nucleotide substitutions, there are many methods for estimation of evolutionary distance. Here are some of the methods that are easy and frequently used by molecular evolutionists.
- p-distance: p-distance is the proportion (p) of the nucleotide site at which the two sequences are different when compared. The number of nucleotide differences divided by the total number of nucleotides compared generally gives p-distance. When the p-distance is small then the number of nucleotide substitutions per site is approximately equal. As long as all the pairwise distances are small, the same result is obtained during while construction of the phylogenetic tree. The p-distance gives the correct topology when the rate of nucleotide substitution is the same for all evolutionary lineages because it has a smaller variance. But it is not a good measure for estimation of the divergence time of the two sequences.
- Jukes-cantor distance: jukes-cantor distance method gives an estimate of the maximum likelihood of the number of nucleotide substitutions between two sequences, and it was developed under the assumption that the rate of nucleotide substitution is the same for all pairs of the four nucleotides A, T, C, and G. if p<0.75 then this distance method can be computed otherwise it is not applicable as the argument of the logarithm becomes negative.
- Tajima-Nei distance: Tajima-Nei distance method is better than that of the Jukes-cantor distance method as it gives better estimates of the nucleotide substitutions. This method of estimation is quite robust and is applicable to a wide variety of cases unless the number of nucleotide substitutions is very large and is known from the computer simulations.
- Kimura 2-parameter distance: Kimura 2-parameter distance model take into account transitional and transversional substitutions rate. It assumes that the rate of substitutions does not vary among sites, and the frequencies of the four nucleotides are the same. With this method, it is possible to compute the number of transitional and transversional nucleotide substitutions per site and their variances.
- Tamura distance: throughout the evolutionary process, Kimura's 2-parameter distance is based on the assumption that the nucleotide frequency is all equal to 0.25. But in drosophila, the G+C content in the mitochondrial DNA is much lower than 0.5. so Tamura developed a method that is suitable for this case on the basis of the maximum likelihood estimator of d.
- Tamura-Nei distance: it is used for phylogenetic inference by the maximum likelihood method. They also derived the variance of d, and the competence of the variance is included in the computer program.
- Gamma distances: parameter a specifies the distribution of the gamma and is the inverse of the coefficient of the variation of the substitution rate (lambda), and the smaller the parameter a, the higher the extent of variation in lambda. Hence, the rate of nucleotide substitution is assumed to follow the gamma distribution specified by parameter a, in the gamma distances.
2. Synonymous and nonsynonymous substitutions
Synonymous and nonsynonymous substitutions are the two types of nucleotide substitutions in the coding genes. The substitutions that do not result in the change of amino acid is the synonymous substitutions while the substitution that results in the change of the amino acids is called the nonsynonymous substitution. The rate of nonsynonymous substitution is less than that of synonymous substitution. There are several methods for estimating the number of synonymous substitutions per synonymous site and the number of nonsynonymous substitutions per nonsynonymous site.
3. Amino acid substitution
The method of estimating the number of amino acid substitutions is similar to that of the nucleotide substitution number estimation method. The distance measures can be computed from the amino acid sequences or from the coding regions of the nucleotides. Amino acid sequences can be translated from the nucleotide sequences by using different genetic codes in the MEGA software tool. When there is a stop codon then the translation process is halted and may lead to producing an error message. It includes:
- p-distance: the statistical properties of p-distance for amino acid substitution are the same as those of the p-distance for nucleotide substitution.
- Poisson correlation distance: this distance is for the estimation of the number of amino acid substitutions per site and each amino acid substitution per site follows the Poisson distribution.
- Gamma distance: gamma distance is the estimation of the number of amino acids per site where the rate of amino acid substitution varies from site to site, following the gamma distribution with parameter a.
Elements of the phylogenetic tree
- Branches and nodes are the main two components that make the phylogenetic tree.
- Mostly everything is connected by a straight line called branches.
- In a phylogram, the period of time between the generations is measured by the length of these branches, while the branches are more or less the same length and do not represent time frames from one generation to the next in the context of the cladogram.
- The branches or the lineage divergence is shown by the nodes. These nodes represent the events that result in the production of the two different species from one common ancestor.
- All the phylogenetic trees are composed of these two main components that are nodes and branches.
- Basically, the unrooted tree does not have the root while comparing to the rooted trees.
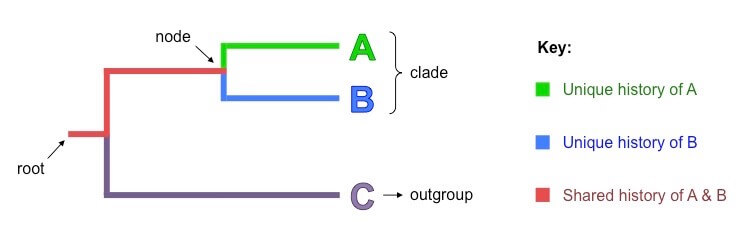
- The most common recent ancestor of all the taxa that are represented on the tree is shown by the root and is also called the base of the tree.
- Taxa are the group of organisms that represents different levels of the taxonomic lineage classification system like (kingdom, phylum, class, order, family, genus, and species).
- The taxa that share the common ancestor are the sister taxa.
- On the phylogenetic tree, sister taxa are more closely related than they are to any taxa.
- Ancestors and all of their descendants in an evolutionary group are determined by the clade.
- As no other taxa are included in the clade, it helps to narrow down the scope of phylogeny so that the evolutionary relationship of the descendants from one ancestor with a tree can be studied in detail.
- The group that is outside of the clade is the outgroup or the taxa that are not similar to that of the taxa in the clade.
Different parts of the phylogenetic tree
- Branches: The path of the genetic information transfer from one generation to another is determined by the branches. The genetic changes are noted by the branch length; that is larger branch length means a higher rate of divergence or more genetic change has occurred. Generally, we estimate the average number of nucleotide or protein substitutions sites and measure the genetic change.
It is more common to see the branch length represented by a scale bar, and this scale indicates the number of substitutions per site. Branch length can be shown on the phylogeny.
A sample sequence alignment of the human and the mouse.
In the simple alignment that is shown in the above figure of human and mouse, we can observe the number of sites that is different from each other between the two sequences. There is one site from both that is different from each other, and on the basis of this, we can say that there are 1/10 = 0.1 substitutions per site. Basically, the evolutionary model is used for interfering with the genetic changes that have occurred.
- Nodes: At the end of the branches there is a node that represents sequences at various points in evolutionary history. The tree consists of the tips, internal nodes, and roots.
- Tips: Tips are also known as the external nodes and represent the sample sequences or the interesting species during the construction of the phylogenetic tree.
- Internal Nodes: The junction point of the branches or the point where more than one branch meets and represents the ancestral sequences is called the Internal Nodes.
- The root is one of the important internal nodes that represent the most recent common ancestors of all the sequences in the constructed phylogenetic tree.
- Root: The root is the most recent common ancestor of all the taxa and one of the important internal nodes in the tree. It tells us the direction of evolution and is one of the oldest parts of the tree. It shows the flow of genetic information moving from the root toward the tip.
If we face difficulty in the visualization of the rooting process, then imagine we are pushing a pin into the string tree (tree made up of string) and rotating the remaining branches around the pin-point.
There are two approaches from where the rooting can be done. They are:
- Outgroup rooting: the sequences that are more distantly related to the sequences of interest are the outgroup. Thus, the root point of the tree is the area where the outgroup sequences touch the rest of the tree of interest. Similarly, if the outgroup is too distantly related, then it may be difficult to align.
- Midpoint rooting: midpoint rooting generally makes us assume all of the sequences are evolving at the same rate, and we must be more careful with this method. During this, the root is positioned at the midpoint between the two branches that are the longest.
- Bootstrap value: the proportion of replicate phylogenies that recovered a particular clade from the original phylogeny that was built using the original phylogeny is the bootstrap value. The bootstrap is a computer-based technique for assessing the accuracy of any statistical estimates and is important for complicated nonparametric estimation problems where the analytical methods are impractical. It helps to test the confidence level between the sequence's similarities.
After summarizing all replicate trees using a consensus method, bootstrap values are mapped on a bootstrap consensus tree. Generally, a tree is constructed using the original full alignments and the bootstrap value is placed on the tree.
Bootstrapping is one of the extremely useful alternatives to the traditional method of hypothesis testing as it is fairly simple and it removes some of the pitfalls that are encountered during the traditional approaches. In the traditional method, one sample of size n is drawn from the population, and a similar sample is used for inference and calculation of the population estimates. Thus, in reality, only one sample has been observed.
The bootstrapping method collects the original sample data and resamples it to create many stimulated samples.
Bootstrap support above 95% is considered very good and well accepted. Similarly, bootstrap support between 75% and 95% is considered reasonably good, and anything below 75% is very poor support. Thus, the bootstrap value below 50% is considered of no use and usually discarded. Even these values below 50% are not displayed in the phylogenetic tree.
Types of the Phylogenetic tree
There are different types of the phylogenetic tree which include:
1. Rooted phylogenetic tree
- A rooted phylogenetic tree is a useful diagram that represents evolutionary history.
- This tree has a basal node that represents the common ancestor of all the groups of the tree and the basal node is also called the node.
- The oldest point in the tree is considered the root and represents the last common ancestor of all groups included in the tree.
- Hence, the direction of the evolutionary time is shown by a rooted tree.
- In order to find the common ancestry or the species' ancestors, tracking back the basal node is necessary from a single species of a rooted tree.
- As the rooted tree shows the direction of the evolutionary time, the older and the newer group can also be found that is present in it.
- Similarly, the study of the entire group of organisms can be done using a rooted tree.
- So, it is very important that the phylogenetic tree is rooted accurately as inaccurate rooting can result in a false interpretation of genetic change between organisms and their direction of evolution.
2. Unrooted phylogenetic tree
- A phylogenetic tree that lacks common ancestors or a basal node is known as an unrooted phylogenetic tree.
- This type of phylogenetic tree does not show the origin of the evolution of the groups of interest.
- The relationship between the organism is only shown without the involvement of the direction of the evolutionary timeline.
- Hence, with the use of an unrooted tree, it becomes difficult to study the evolutionary relationship of the groups with respect to time.
- But the unrooted phylogenetic tree can be rooted in the following ways:
- Finding an outgroup: when there is knowledge about the relationships between the taxa, then the outgroup can be found. Thus, the taxon can be used as an outgroup to draw a phylogenetic tree that has been lying outside the group.
- Finding the midpoint or distance: the most distant two taxa's midpoint in a tree can be assumed as a root for the phylogenetic tree.
3. Bifurcating tree
A bifurcating tree is one in which exactly two descendent lineages arise from each ancestral lineage. A tree with bifurcating mode is known as bifurcating tree.
4. The multi-furcating tree
In these types of trees, multiple descendants arise from each of the interior nodes.
Steps for preparing the phylogenetic tree
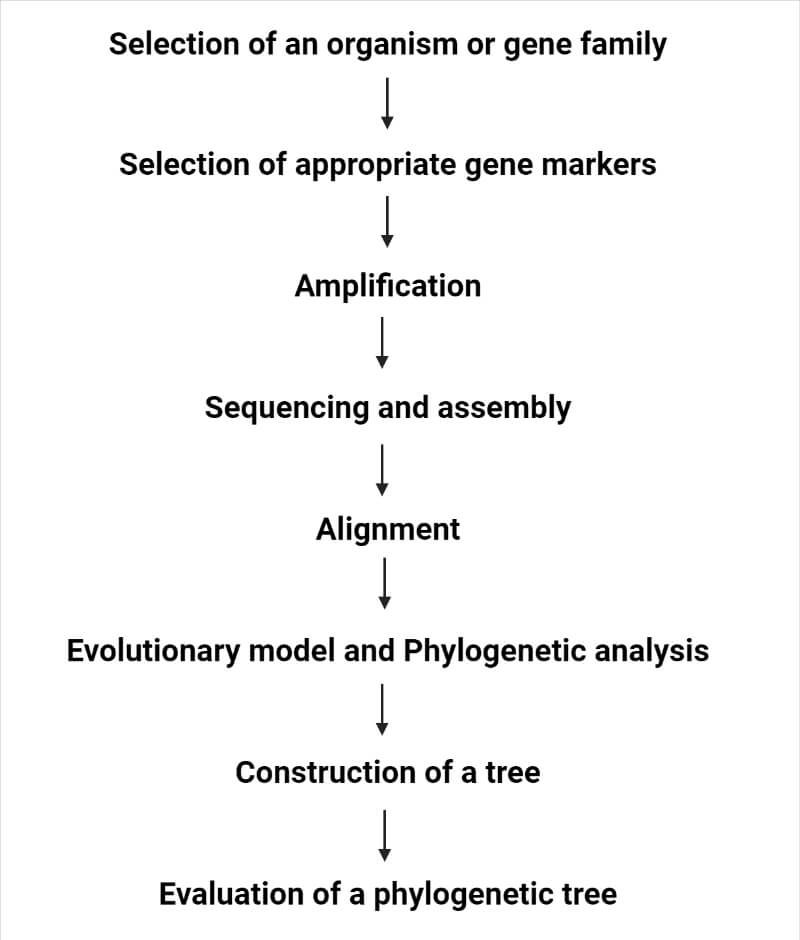
Methods for phylogenetic tree construction
There are different methods for the construction of the phylogenetic tree, which include:
1. Distance matrix method
The distance matrix method is a type of phylogenetic analysis method that relies on the measure of genetic distance between the sequences been classified. Here, distance is the fraction of mismatch between the two aligned positions of sequences, where the gaps are either ignored or counted as a mismatch. The distance method describes the distance between each pair of the sequence and from the sequence query it attempts to construct an all-to-all matrix. The phylogenetic tree constructed from this method places the closely related sequences under the same interior nodes and their branch length produces the distances between each sequences pairs. Depending on the algorithm used to calculate the distances, the tree produced can either be rooted or unrooted. They are mainly and progressively used for different types of multiple sequence alignment. But their inability to use the information of local high variations regions that appears across multiple subtrees is one of the disadvantages of the matrix-distance method. Some of the matrix distance methods are:
- Neighbor-joining: this method is fast and can be used with a variety of models as compared to that of the character-based method. The neighbor-joining method provides an unrooted and single resultant tree. For the analysis of the sequences using genetic distance as a clustering metric, it uses the general data clustering method. The neighbor-joining method produces does not assume a constant rate of evolution across lineage as the sample produced by this method is unrooted. But the rooted trees are produced by the UPGMA (unweighted pair group method and arithmetic mean) method and its assumption rate must be constant which means it assumes an ultrametric tree in which the distance from the root to every branch tip is equal.
- Using outgroups: the information about the relationship between sequences or a group that is independent of each other can be used to reduce the tree search space and root an unrooted tree. The distant-matrix method involves the presence of at least one outgroup sequence that is distantly related to the sequences of interest in the query set. Outgroup can be observed as a type of experimental control. If the outgroup has been chosen appropriately then it will appear near the root of a rooted tree and as compared to other sequences it will have a much greater genetic distance along with the longer branch length. The outgroup sequences must be moderately related to the sequences of interest. Care should be taken while choosing the sequences of the species as they must be distantly related but the gene encoded by the sequence is highly conserved across lineages.
2. Maximum parsimony
Maximum parsimony is one of the methods for identifying the potential phylogenetic tree in which the observed sequence data are explained with the help of the smallest total number of evolutionary events. When every possible type is not equally likely then this approach is very useful, for example, when the amino acids and nucleotides are known to be more mutable. Simple enumeration is the most native way of the identification of parsimonious trees- considering the succession of each possible tree and scanning for the tree with the smallest score. Various other methods for optimization have been developed for the location of the highly parsimonious trees which include a steepest descent-style minimization mechanism operating on a tree rearrangement criterion. This method includes:
- Branch and bound
One of the general methods used to increase the efficiency of searches for near-optimal solutions to NP-hard problems is the branch and bound method. As it divides the problem into a tree structure and subdivides the problem space into smaller regions, it is well suited for the construction of the phylogenetic tree. As its name implies, it requires both the branching rule and the bounding rule. The most challenging aspect of algorithms application is the identification of good bound. The maximum number of assumed evolutionary changes allowed per tree is the simple way of identifying the bound.
- MALIGAN and POY
MALIGAN method uses the maximum parsimony technique for computing multiple alignments by cladogram score maximization, while POY uses an iterative method that couples the optimization of the phylogenetic tree with improvements in the corresponding MSA. Both of the programs are available at the American Museum of Natural History.
3. Maximum likelihood
The maximum likelihood method is the use of the standard statistical technique for inferring probability distribution to assign probabilities to a particular possible phylogenetic tree and requires a substitution model to access the probability of particular mutations. It is suitable for very dissimilar sequences and hypotheses about an evolutionary relationship can be formulated. With the help of this method, a phylogenetic tree can be constructed for a small number of taxa within a reasonable timeframe. This is similar to that of the maximum parsimony method but this method allows permission for varying rates of evolution across both lineages and sites. The maximum likelihood method is well suited for the analysis of distantly related sequences but it is computationally expensive for performing more than sequences.
Different algorithms are often used like "pruning" to reduce the search space by efficient calculations of the likelihood subtrees. Starting from a node whose descendants are leaves and backward towards the bottom node in nested sets, it calculates the likelihood of each site in a linear manner. If the substitution method is irreversible then the tree produced by this method is rooted. Under a given evolutionary model, it tries to find the highest probability to generate the input sequences.
4. UPGMA
The UPGMA (unweighted pair group method with arithmetic mean) is the simplest method of tree construction. It was developed for the construction of trees that reflect the phenotypic similarities that are taxonomic phenograms. If the rate of evolution is approximately constant among the different lineages even though it is used for the construction of the phylogenetic tree and for this a number of nucleotides and amino acids substitutions can be used. It is reliable for related sequences and it generally provides a rooted tree. Following the different steps, this method is used for the construction of the phylogenetic tree.
Importance of phylogenetic tree
- It is used for searching for new species.
- It is used for studying evolutionary history.
- Used for studying how the species spread geographically.
- Used for studying the common ancestors of present and extinct species.
- To find how closely are the species related and their recent common ancestors.
- It is used to represent the evolutionary relationship among the organisms and trace the infectious microbes with the help of evolutionary histories.
Applications of phylogenetic analysis
- Phylogenetic analysis provides in-depth knowledge and understanding of the species that evolved through different genetic modifications. Using this technique scientists and researchers are able to identify the path that connects the present-day organisms with their ancestral origin and is able to predict the genetic divergence that might occur in the future.
- It has applications in wide areas including medical and biological fields along with forensic science, conservation biology, drug discovery, epidemiology, prediction of protein structure and functions, and gene function prediction.
- It is applicable to accurately estimate the evolutionary relationship among species by the use of gene sequence data in molecular phylogenetic analysis.
- Phylogenetic analysis is also applicable for gathering information related to pathogen outbreaks. Besides this, the source of pathogen transmission can also be investigated by linking the epidemiological linkages.
- It plays a vital role in conservation biology for the prediction of the species which are in the verse of extension and which species must be taken care of.
- Phylogenetic analysis is also applicable in comparative genomics for studying relationships between the genome of different species and one example of it is gene finding.
- Similarly screening pharmacologically related species helps to identify the members which have closer pharmacological significance.
- It is also applicable in the field of microbiology for the identification and classification of various organisms, including bacteria.
- It is also applicable for the study of reciprocal interaction between microorganisms and identification of the horizontal gene transfer mechanism by which organisms are able to rapidly adapt to the microenvironment.
References
- https://academic.oup.com/mbe/article/35/9/2327/5034460
- https://bio.davidson.edu/courses/genomics/seq/treeparts.html
- https://bio.libretexts.org/Bookshelves/Introductory_and_General_Biology/Book%3A_General_Biology_(Boundless)/20%3A_Phylogenies_and_the_History_of_Life/20.01%3A_Organizing_Life_on_Earth/20.1A%3A_Phylogenetic_Trees
- https://bioprinciples.biosci.gatech.edu/module-1-evolution/phylogenetic-trees/
- https://bip.weizmann.ac.il/education/course/introbioinfo/03/lect12/phylogenetics.pdf
- https://byjus.com/biology/phylogenetic-tree/
- https://link.springer.com/protocol/10.1007/978-1-0716-1728-1_27
- https://medium.com/@sharma.ravit/upgma-method-designing-a-phylogenetic-tree-9a708de18419
- https://pdlab.csie.chu.edu.tw/K.M.Yu/Download/Proceedings/2006/06.EGBS-2006
- https://pediaa.com/what-is-the-difference-between-rooted-and-unrooted-phylogenetic-tree/
- https://rcs.cic.ipn.mx/2017_139/A%20Distance%20Measure%20for%20Building%20Phylogenetic%20Trees_%20A%20First%20Approach.pdf
- https://si.biostat.washington.edu/sites/default/files/modules/Lecture%2004%20Trees%20and%20Distances.pdf
- https://study.com/learn/lesson/phylogenetic-tree-parts-types.html#:~:text=So%20the%20parts%20of%20a,are%20share%20a%20common%20ancestor.
- https://towardsdatascience.com/bootstrapping-statistics-what-it-is-and-why-its-used-e2fa29577307
- https://www.bionity.com/en/encyclopedia/Computational_phylogenetics.html
- https://www.differencebetween.com/difference-between-rooted-and-vs-unrooted-phylogenetic-tree/
- https://www.ebi.ac.uk/training/online/courses/introduction-to-phylogenetics/what-is-a-phylogeny/aspects-of-phylogenies/confidence/
- https://www.icp.ucl.ac.be/~opperd/private/upgma.html
- https://www.isical.ac.in/~zahid_t/ibm.pdf
- https://www.khanacademy.org/science/ap-biology/natural-selection/phylogeny/a/phylogenetic-trees
- https://www.megasoftware.net/mega1_manual/Distance.html
- https://www.megasoftware.net/web_help_11/Kimura_2-parameter_distance.htm
- https://www.nature.com/scitable/content/phylogenetic-terminology-33719/
- https://www.nature.com/scitable/topicpage/reading-a-phylogenetic-tree-the-meaning-of-41956/
- https://www.ncbi.nlm.nih.gov/pmc/articles/PMC7123334/table/Tab1/?report=objectonly
- https://www.news-medical.net/health/What-is-Phylogenetic-Analysis.aspx
- https://www.researchgate.net/figure/Phylogenetic-tree-rooted-was-constructed-by-UPGMA-method-without-out-group-also-show_fig5_273776425
- https://www.researchgate.net/figure/The-different-parts-of-a-rooted-phylogenetic-tree-showing-the-root-branches-nodes-and_fig1_43022487
- https://www.researchgate.net/post/How_can_I_interpret_bootstrap_values_on_phylogenetic_trees_built_with_Maximum_Likelihood_method
- https://www.researchgate.net/publication/284228847_Ultrametric_Tree_Construction_and_Evaluation_Platform_UTCE_in_Grid_Computing_System
- https://www.sciencedirect.com/topics/biochemistry-genetics-and-molecular-biology/phylogenetic-tree
- Legumes in the Omic Era – Scientific Figure on ResearchGate. Available from: https://www.researchgate.net/figure/Figure-showing-phylogenetic-tree-terminologies_fig16_278700338 [accessed 13 Jul 2022]
Source: https://thebiologynotes.com/phylogenetic-tree-analysis-elements-methods-uses/
0 Response to "how to draw a phylogenetic tree and the evolutionary changes"
Post a Comment